The short version
2026 editionKey takeaways
Each takeaway links to its canonical data row. Reported figures belong to their cited producer; modeled results are labeled as calculations.
- Agency records with monthly SEO fees below USD 1,000: 64% (Published December 2024; fieldwork dates not stated).SE Ranking and Duda
- Agency records with hourly SEO fees of USD 50–100: 45% (Published December 2024; fieldwork dates not stated).SE Ranking and Duda
- US/Canada agency records with hourly SEO fees above USD 125: 40% (Published December 2024; fieldwork dates not stated).SE Ranking and Duda
- European agency records with hourly SEO fees above USD 125: 6% (Published December 2024; fieldwork dates not stated).SE Ranking and Duda
- Agency records with SEO project fees of USD 500–1,000: 38% (Published December 2024; fieldwork dates not stated).SE Ranking and Duda
- Agency records with SEO project fees of USD 1,000–2,000: 28% (Published December 2024; fieldwork dates not stated).SE Ranking and Duda
- Agency records with monthly SEO fees below USD 500: 30% (Published December 2024; fieldwork dates not stated).SE Ranking and Duda
- Agencies raising rates in Promethean’s 2024 comparison: 22% (2024).Promethean Research
- Agencies raising rates in Promethean’s 2025 comparison: 28% (2025).Promethean Research
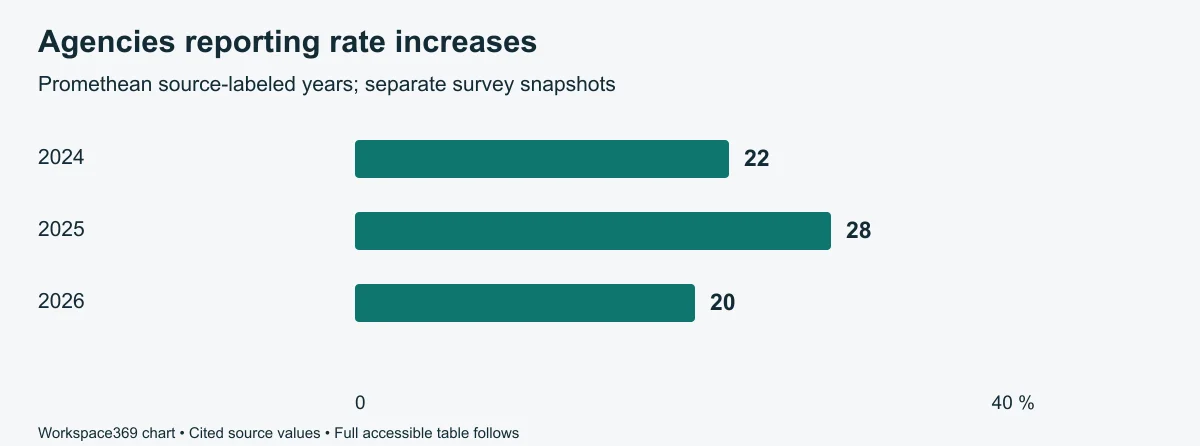
- Agencies raising rates in Promethean’s 2026 comparison: 20% (2026).Promethean Research
What SEO prices do agencies publicly advertise in October 2026?
These five observations from three providers are advertised offers, not fees paid by surveyed clients. The services differ, so the table is a scope comparison rather than a cheapest-provider ranking or market average.
Scroll horizontally to compare all columns →
| Provider and offer | Advertised USD per month | Service context | Commitment |
|---|---|---|---|
| Thrive: SEO starting price | $500.00 | Chicago service page; scope depends on the quote | Commitment not specified on the cited page |
| Straight North: SEO starting price | $1,500.00 | Tailored SEO; goals and competition affect scope | Commitment not specified on the cited page |
| WebFX: AI SEO Bronze | $3,000.00 | AI visibility software and optimization services | Six-month commitment |
| WebFX: AI SEO Silver | $5,250.00 | AI visibility software and optimization services | Six-month commitment |
| WebFX: AI SEO Gold | $7,500.00 | AI visibility software and optimization services | Six-month commitment |
Convenience selection of providers with readable public prices. Several tiers from one provider are not independent agencies. Starting prices are floors, not typical paid fees. Setup charges, taxes and exclusions are not consistently specified; no total-contract cost or average is inferred.
Primary sources: Thrive Internet Marketing Agency — checked October 9, 2026 · Straight North — checked October 9, 2026 · WebFX — checked October 9, 2026
What do the published SEO agency pricing bands show?
The older SEO study provides budget context, not a current quote. Keep service scope and geography attached to each band; do not turn a category share into an average fee.
| Reported pricing measure | Share |
|---|---|
| Monthly fee below USD 1,000 | 64% |
| Monthly fee below USD 500 | 30% |
| Hourly fee USD 50–100 | 45% |
| US/Canada hourly fee above USD 125 | 40% |
| Europe hourly fee above USD 125 | 6% |
| Project fee USD 500–1,000 | 38% |
| Project fee USD 1,000–2,000 | 28% |
Nested and regional groups must not be added. This is a historical pricing sample, not a representative census or a 2026 rate card.
Primary source: SE Ranking and Duda — December 13, 2024
Are agencies still raising rates?
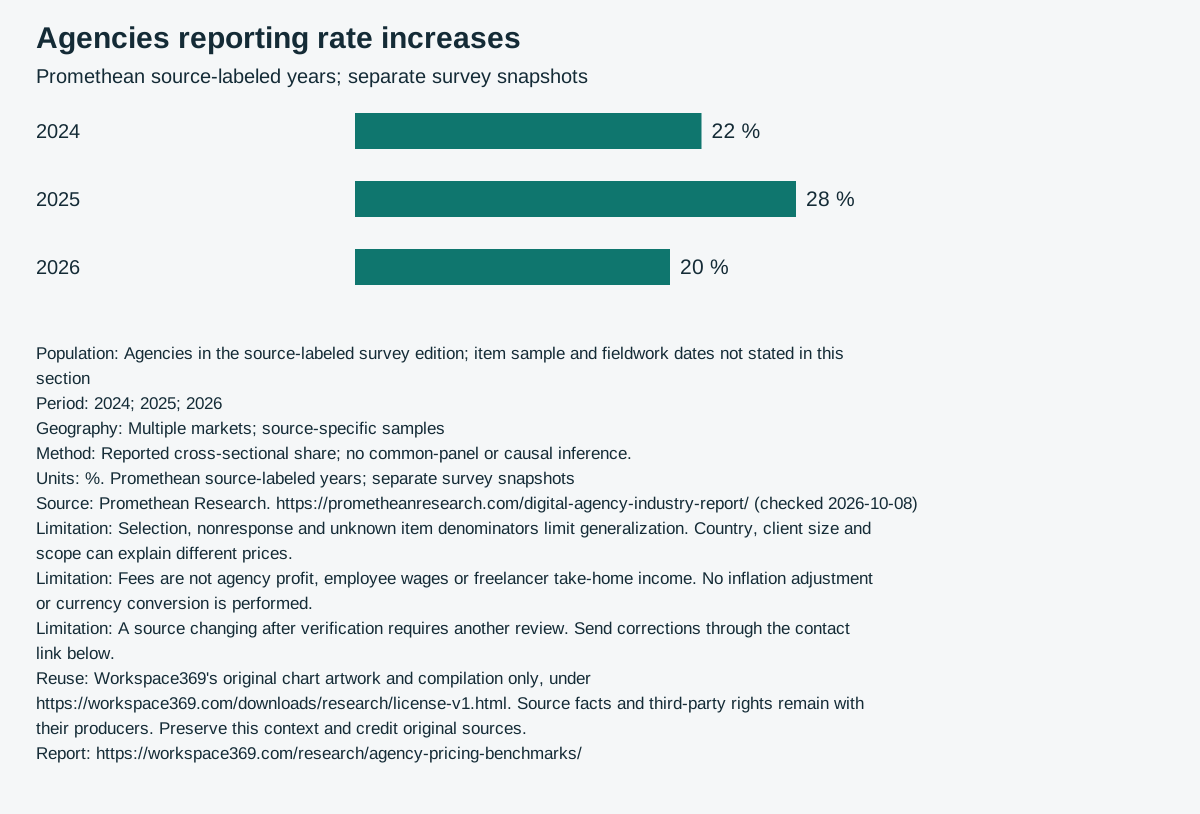
Promethean reports a different share raising rates in each edition. These repeated survey snapshots do not prove the same agencies changed behavior or establish the amount of any increase.
| Source-labeled year | Share raising rates |
|---|---|
| 2024 | 22% |
| 2025 | 28% |
| 2026 | 20% |
Different study and population from the SEO pricing table. Do not combine their percentages.
Primary source: Promethean Research — checked October 8, 2026
How should an agency turn a benchmark into a quote?
Define deliverables before applying a rate. Specify research, implementation, reporting, meetings, revisions and exclusions; then estimate effort and obtain approval for changes.
For ongoing work, document the period, capacity or deliverables purchased, rollover, overages and renewal terms. An hourly benchmark is not a fixed-project quote, and a retainer describes an agreement rather than a guaranteed result.
Is this a Workspace369 agency survey?
No. Workspace369 curated the cited findings. No respondent recruitment or original survey was conducted for this page.
An original study would need a defined service, geography, observation period, recruitment method and usable-response count before publishing results. Ask about an actual completed or contracted engagement, distinguish quoted from collected fees, and report sample limitations.
How this report was built
Methodology and limitations
- Public offers were checked on October 9, 2026. We record the listed monthly price, service context, commitment and exact source section. This desk research did not recruit respondents, request quotes, purchase services or observe completed contracts.
- The SEO study combines survey responses and catalog observations. We preserve selected published bands and source locators without constructing an average or estimating omitted categories.
- The edition year identifies this evidence review. The older SEO observations are explicitly dated; they are not 2026 transactions. Promethean rate-change shares remain a separate series.
- We excluded the disputed Promethean hourly-rate distribution: its body percentage and embedded chart did not agree at review. We also excluded internally inconsistent summary figures in the older Ahrefs SEO pricing article.
What these numbers cannot tell you
- Selection, nonresponse and unknown item denominators limit generalization. Country, client size and scope can explain different prices.
- Fees are not agency profit, employee wages or freelancer take-home income. No inflation adjustment or currency conversion is performed.
- A source changing after verification requires another review. Send corrections through the contact link below.
Freshness and corrections
Maintained by the Workspace369 editorial team. Editorial owner reviews sources quarterly and before annual edition updates. Next review January 2027. The edition date changes only when the evidence or content is substantively reviewed; it does not change the underlying observation period.
First edition: . Data extraction, source attribution and arithmetic checked for this edition. No independent peer review is claimed.
Found an error or a newer primary release? Send a correction with the source and affected statistic. Confirmed corrections are recorded below before republishing.
Revision history
Evidence dates above describe the report. Download and citation updates below do not imply that sources were checked again.
- — Versioned CSV and JSON archives, checksums and reference-manager exports added. Source observations and evidence dates are unchanged.
Primary sources and provenance
Every reported numeric cell links directly to its producer. The downloads include exact table or workbook locators, observation periods, access dates, formulas and input references.
- SE Ranking and DudaSEO pricing survey insights: How much does SEO cost in 2025? ↗Published December 13, 2024. Accessed October 8, 2026.Selected factual observations with attribution. Copyright in the source report remains with its publisher; this compilation does not relicense the report or raw responses.
- Promethean ResearchDigital Agency Industry Report ↗Publication date not recorded; see the original source. Accessed October 8, 2026.Selected factual observations with attribution; source report, chart artwork and underlying survey remain with Promethean Research.
- Thrive Internet Marketing AgencyChicago SEO services: published starting price ↗Publication date not recorded; see the original source. Accessed October 9, 2026.Selected public price facts with attribution. Provider content retains its original copyright. No endorsement or guarantee of availability.
- Straight NorthWashington DC SEO services: pricing FAQ ↗Publication date not recorded; see the original source. Accessed October 9, 2026.Selected public price facts with attribution. Provider content retains its original copyright. No endorsement or guarantee of availability.
- WebFXAI SEO pricing and plans ↗Publication date not recorded; see the original source. Accessed October 9, 2026.Selected public price facts with attribution. Provider content retains its original copyright. No endorsement or guarantee of availability.
Made to be checked, then cited
How to cite this report
For a source-reported statistic, credit the original publisher and link to the exact row here when using our compilation. For a modeled result, cite Workspace369 and include the assumptions. Linking to this page does not make us the original producer of third-party data.
Workspace369. (2026-10-09). What Agencies Charge for SEO: 2026 Evidence Review. https://workspace369.com/research/agency-pricing-benchmarks/. Primary sources and observation periods as listed in the report.
Download reusable chart with sources and limitations ↓
Versioned data
Use an archived file when your analysis needs to stay reproducible. The version identifies the exact CSV and JSON bytes; unchanged data keeps the same version.
Dataset version: 648b253d9d73f1798082802a091ef2b2ae21205d1d5112c9b82334088c58adae
Reference exports describe Workspace369’s compilation. When citing a reported observation, also credit its original producer.