The short version
2026 editionKey takeaways
Each takeaway links to its canonical data row. Reported figures belong to their cited producer; modeled results are labeled as calculations.
- All analyzed proposals: proposal close rate: 34% (2026 report edition; exact proposal observation dates undisclosed).Proposify
- Digital marketing: proposal close rate: 48% (2026 report edition; exact proposal observation dates undisclosed).Proposify
- Accounting: proposal close rate: 47% (2026 report edition; exact proposal observation dates undisclosed).Proposify
- Non-profit: proposal close rate: 53% (2026 report edition; exact proposal observation dates undisclosed).Proposify
- Legal services: average proposal closing time: 1.2 days (2026 report edition; exact proposal observation dates undisclosed).Proposify
- Human resources services: average proposal closing time: 1.73 days (2026 report edition; exact proposal observation dates undisclosed).Proposify
- Event management: average proposal closing time: 12.16 days (2026 report edition; exact proposal observation dates undisclosed).Proposify
- Wholesale distribution: average proposal closing time: 14.91 days (2026 report edition; exact proposal observation dates undisclosed).Proposify
- Winning proposals: average document length: 11 (2026 report edition; exact proposal observation dates undisclosed).Proposify
- Losing proposals: average document length: 13 (2026 report edition; exact proposal observation dates undisclosed).Proposify
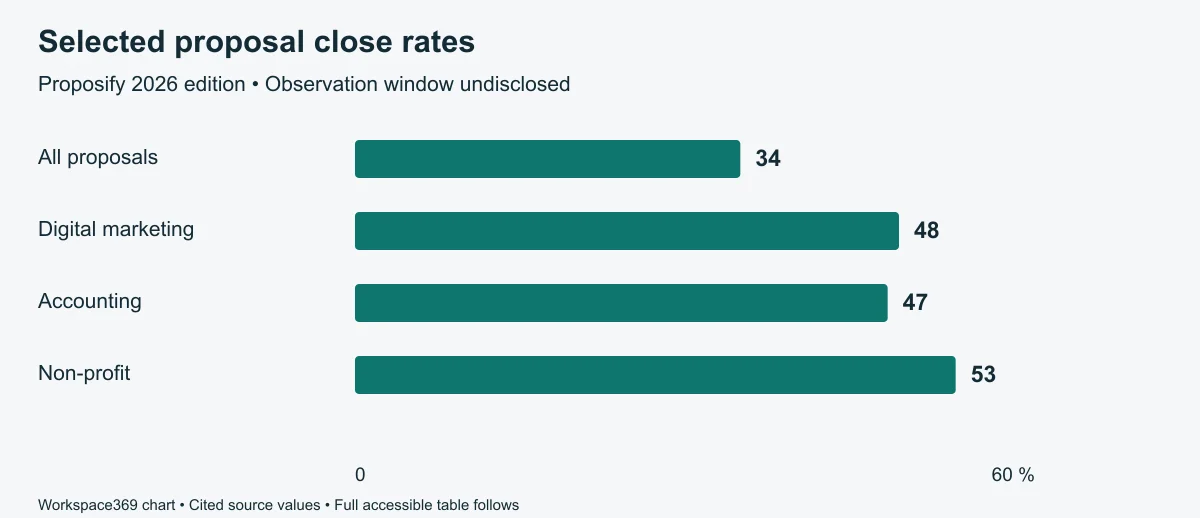
What proposal close rates does the platform report?
The published overall close rate is 34%; selected industry groups differ. These are proposal-level observations, not a universal lead-to-customer conversion rate.
| Proposal group | Reported close rate |
|---|---|
| All analyzed proposals | 34% |
| Digital marketing | 48% |
| Accounting | 47% |
| Non-profit | 53% |
The producer describes 742,137 proposals across 30 industries overall. That total is not the denominator of each selected industry row.
Primary source: Proposify — August 18, 2026
How long did selected proposal groups take to close?
Reported closing times vary by industry. A timing average does not tell us when an unresolved proposal should be marked lost.
| Industry | Reported average days to close |
|---|---|
| Legal services | 1.2 days |
| Human resources services | 1.73 days |
| Event management | 12.16 days |
| Wholesale distribution | 14.91 days |
The public summary does not fully define event timestamps, censoring or whether every closure outcome is included. Do not directly compare with your full sales-cycle duration.
Primary source: Proposify — August 18, 2026
Do shorter proposals cause more wins?
The source reports an average of 11 pages for winning proposals and 13 for losing proposals. This comparison does not establish an optimal document length or a causal effect.
| Outcome group | Average pages |
|---|---|
| Winning | 11 |
| Losing | 13 |
Scope, buyer readiness and deal complexity could differ between groups. Do not remove necessary commercial terms to meet a page-count target.
Primary source: Proposify — August 18, 2026
How should you calculate your own proposal close rate?
Choose a sent-date cohort and a fixed follow-up date. Count one commercial opportunity once, retain open outcomes separately, and state the denominator before comparing periods.
Report accepted ÷ all sent for the cohort alongside accepted ÷ (accepted + declined) for resolved proposals. Neither is automatically comparable to a vendor’s rate. Exclude internal tests, deduplicate revisions, keep withdrawals visible, and separate acceptance from invoice payment. Record cohort maturity so recent open proposals do not look like failures.
What should a team improve before running an experiment?
Make scope, price, approval responsibility and the next action clear. Check delivery and access before changing the proposal based on a benchmark.
If testing a change, define the outcome and allocation rule beforehand. Track deal mix and unresolved outcomes. A document view is not an acceptance, an identified decision-maker or a completed payment.
How this report was built
Methodology and limitations
- Selected public findings from the original platform producer are reproduced with section locators; no access to underlying proposal records is claimed.
- The publication year is retained as an edition label because exact observation dates and complete close-rate definitions are not supplied in the public summary.
- We excluded the pre-signing performance claim because the summary and body disagree about the faster-close percentage. No causal benefit from video, signatures or length is asserted.
What these numbers cannot tell you
- A vendor-platform sample can differ from your customer mix and sales process. This is not Workspace369 performance evidence.
- Industry denominators, uncertainty intervals and full eligibility rules remain unknown.
- The proposed cohort method is a measurement specification, not a claim that your live tracking already implements it.
Freshness and corrections
Maintained by the Workspace369 editorial team. Workspace369 editorial team reviews quarterly and when a producer releases a new edition. Next review January 2027. The edition date changes only when the evidence or content is substantively reviewed; it does not change the underlying observation period.
First edition: . Data extraction, source attribution and arithmetic checked for this edition. No independent peer review is claimed.
Found an error or a newer primary release? Send a correction with the source and affected statistic. Confirmed corrections are recorded below before republishing.
Revision history
Evidence dates above describe the report. Download and citation updates below do not imply that sources were checked again.
- — Versioned CSV and JSON archives, checksums and reference-manager exports added. Source observations and evidence dates are unchanged.
Primary sources and provenance
Every reported numeric cell links directly to its producer. The downloads include exact table or workbook locators, observation periods, access dates, formulas and input references.
- Proposify10 Sales Closing Statistics for 2026: What 742K Proposals Reveal About Winning Deals ↗Published August 18, 2026. Accessed October 9, 2026.Selected factual observations with attribution. Original report and underlying records remain with their producer; no raw responses or complete report redistributed.
Made to be checked, then cited
How to cite this report
For a source-reported statistic, credit the original publisher and link to the exact row here when using our compilation. For a modeled result, cite Workspace369 and include the assumptions. Linking to this page does not make us the original producer of third-party data.
Workspace369. (2026-10-09). Proposal Close Rate Benchmarks: A 2026 Evidence Review. https://workspace369.com/research/proposal-close-rate-benchmarks/. Primary sources and observation periods as listed in the report.
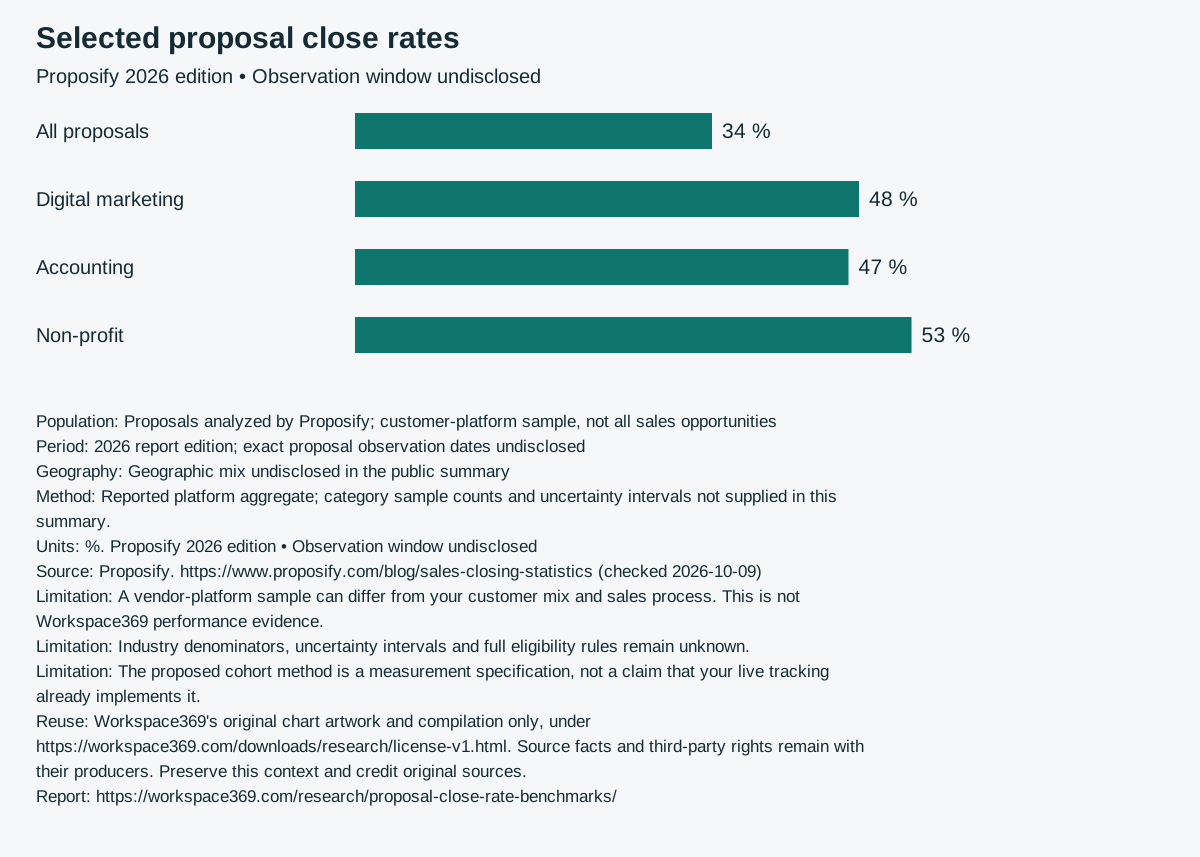
Download reusable chart with sources and limitations ↓
Versioned data
Use an archived file when your analysis needs to stay reproducible. The version identifies the exact CSV and JSON bytes; unchanged data keeps the same version.
Dataset version: 1f2f4f8016947cb2d4d56752e60cff1525190b6bfe9656128b7bcde9ec601b62
Reference exports describe Workspace369’s compilation. When citing a reported observation, also credit its original producer.