The short version
2026 editionKey takeaways
Each takeaway links to its canonical data row. Reported figures belong to their cited producer; modeled results are labeled as calculations.
- Overall agency after-tax net margin: 13% (2025 financial results).Promethean Research
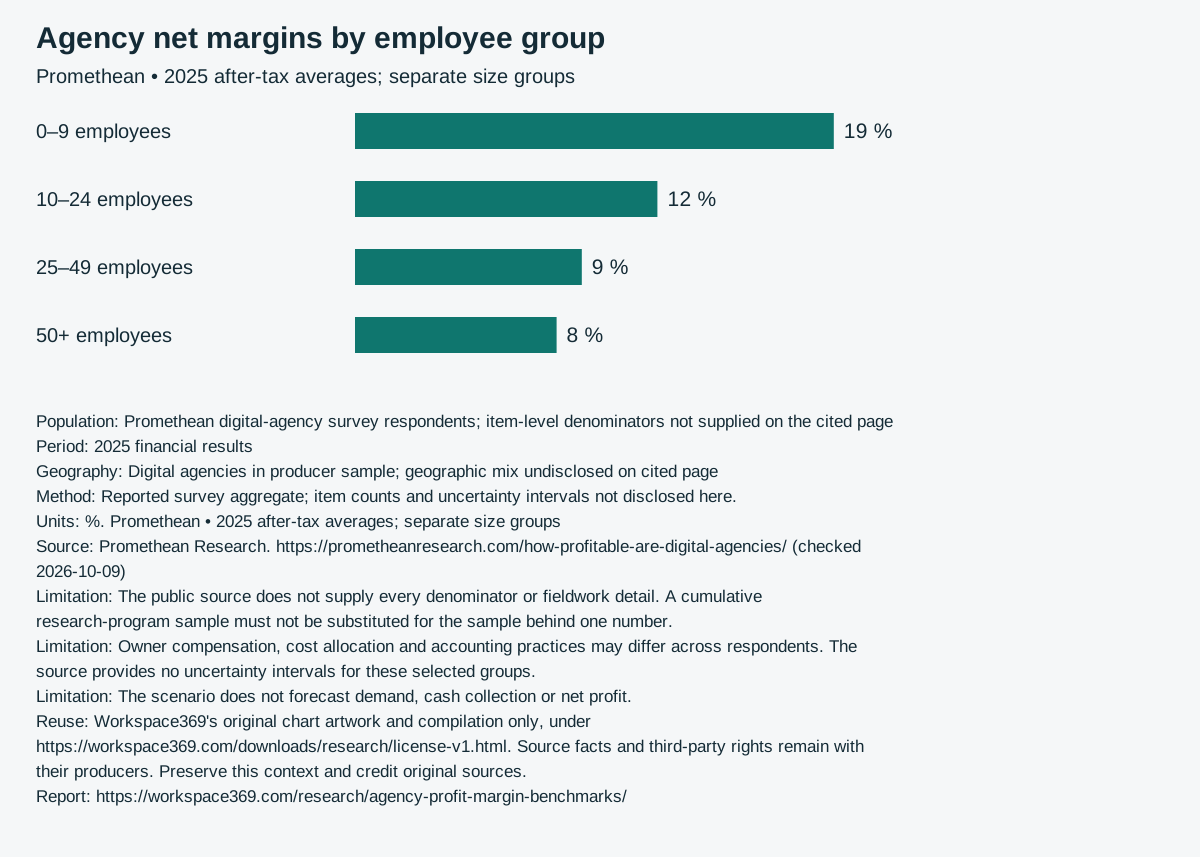
- 0–9 employees: agency after-tax net margin: 19% (2025 financial results).Promethean Research
- 10–24 employees: agency after-tax net margin: 12% (2025 financial results).Promethean Research
- 25–49 employees: agency after-tax net margin: 9% (2025 financial results).Promethean Research
- 50+ employees: agency after-tax net margin: 8% (2025 financial results).Promethean Research
- Surveyed agencies tracking project margins: 59% (2026 survey edition; fieldwork dates undisclosed).Promethean Research
- Average project margin among agencies tracking it: 35% (2026 survey edition; fieldwork dates undisclosed).Promethean Research
- Modeled price for USD 1000 direct project cost: $1,538.46 (2026 illustrative scenario).Workspace369 calculation
- Modeled project margin amount for USD 1000 direct project cost: $538.46 (2026 illustrative scenario).Workspace369 calculation
- Modeled price for USD 5000 direct project cost: $7,692.31 (2026 illustrative scenario).Workspace369 calculation
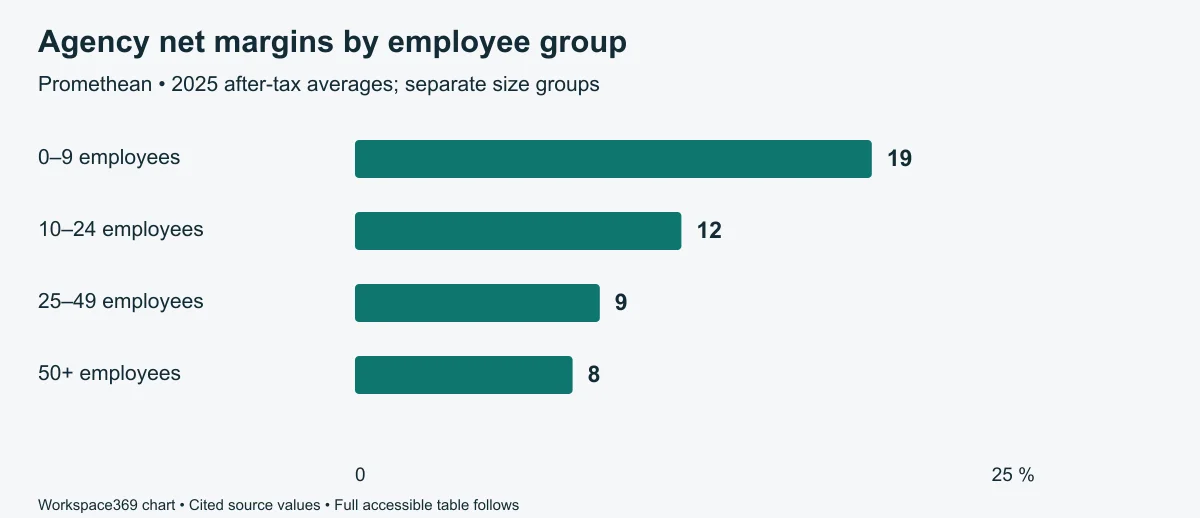
What after-tax net margins does the agency sample report?
Promethean reports a 13% mean after-tax net margin for 2025. Compare the relevant size group before judging a business against that aggregate.
| Agency group | Mean after-tax net margin |
|---|---|
| Overall | 13% |
| 0–9 employees | 19% |
| 10–24 employees | 12% |
| 25–49 employees | 9% |
| 50+ employees | 8% |
These are cross-sectional group averages, not a prediction that hiring another employee causes margins to fall.
Primary source: Promethean Research — April 19, 2026
Is project margin the same as net margin?
No. Project margin concerns project revenue and costs; after-tax net margin concerns the whole business. In the producer’s 2026 survey, the project-margin average applies only to agencies that track it.
| Separate survey measure | Value |
|---|---|
| Agencies tracking individual project margins | 59% |
| Average project margin among those tracking it | 35% |
Do not subtract these different-sample averages and call the result a measured overhead ratio.
Primary source: Promethean Research — April 19, 2026
How does an assumed project margin translate cost into price?
Workspace369 uses the reported project-margin value as an illustrative target and applies price = direct project cost ÷ (1 − margin). This is pricing arithmetic, not evidence that a buyer will accept the price.
Scroll horizontally to compare all columns →
| Assumed direct project cost, USD | Modeled price, USD | Modeled project margin amount, USD |
|---|---|---|
| 1000 | $1,538.46Illustrative calculation | $538.46Illustrative calculation |
| 5000 | $7,692.31Illustrative calculation | $2,692.31Illustrative calculation |
| 10000 | $15,384.62Illustrative calculation | $5,384.62Illustrative calculation |
The modeled project margin amount is not after-tax profit. The assumed cost must include the direct project costs your accounting definition requires; overhead and taxes remain outside this example.
How should an agency investigate a weak margin?
Reconcile the reporting period and accounting definitions first. Then inspect scoped versus actual direct project cost, approved changes, write-offs and shared costs before choosing a remedy.
Use a consistent project ledger and reconcile it to the business accounts. Keep quoted price, recognized revenue, invoices and cash collected distinct. A profitable-looking project does not establish healthy cash flow.
Your project, your assumptions
What price covers your target project margin?
Compare a proposed price with direct project costs, then test a scope increase. Inputs stay in this browser and are not sent with analytics.
- Price for target margin
- $7,692.31
- Project margin at proposed price
- 37.5%
- Project margin amount at proposed price
- $3,000.00
- Markup on direct project cost
- 60%
- Price for the same target margin after cost increase
- $9,230.77
- Margin after cost increase if price stays unchanged
- 25%
Price = direct project cost ÷ (1 − target margin). Margin divides the difference by price; markup divides it by cost. Results exclude overhead, taxes and collection risk, and do not predict buyer acceptance. The default values are illustrative assumptions, not a recommended price. Downloads use English field names and USD.
Turn agreed scope and price into a proposal →How this report was built
Methodology and limitations
- Selected reported aggregates retain their source populations and periods. No combined average is calculated across size groups.
- The scenario table is Workspace369 arithmetic. Assumed costs are illustrative, the target is not a recommendation, and final outputs are rounded to cents.
What these numbers cannot tell you
- The public source does not supply every denominator or fieldwork detail. A cumulative research-program sample must not be substituted for the sample behind one number.
- Owner compensation, cost allocation and accounting practices may differ across respondents. The source provides no uncertainty intervals for these selected groups.
- The scenario does not forecast demand, cash collection or net profit.
Freshness and corrections
Maintained by the Workspace369 editorial team. Workspace369 editorial team reviews quarterly and when a producer releases a new edition. Next review January 2027. The edition date changes only when the evidence or content is substantively reviewed; it does not change the underlying observation period.
First edition: . Data extraction, source attribution and arithmetic checked for this edition. No independent peer review is claimed.
Found an error or a newer primary release? Send a correction with the source and affected statistic. Confirmed corrections are recorded below before republishing.
Revision history
Evidence dates above describe the report. Download and citation updates below do not imply that sources were checked again.
- — Versioned CSV and JSON archives, checksums and reference-manager exports added. Source observations and evidence dates are unchanged.
Primary sources and provenance
Every reported numeric cell links directly to its producer. The downloads include exact table or workbook locators, observation periods, access dates, formulas and input references.
- Promethean ResearchHow Profitable are Digital Agencies? ↗Published April 19, 2026. Accessed October 9, 2026.Selected factual observations with attribution. Original report and underlying records remain with their producer; no raw responses or complete report redistributed.
Made to be checked, then cited
How to cite this report
For a source-reported statistic, credit the original publisher and link to the exact row here when using our compilation. For a modeled result, cite Workspace369 and include the assumptions. Linking to this page does not make us the original producer of third-party data.
Workspace369. (2026-10-09). Agency Profit Margin Benchmarks: Project and Net Margins. https://workspace369.com/research/agency-profit-margin-benchmarks/. Primary sources and observation periods as listed in the report.
Download reusable chart with sources and limitations ↓
Versioned data
Use an archived file when your analysis needs to stay reproducible. The version identifies the exact CSV and JSON bytes; unchanged data keeps the same version.
Dataset version: a309aba17d4fea4a41b56288c3934d385b14de591ab7f6308381d16b1100366f
Reference exports describe Workspace369’s compilation. When citing a reported observation, also credit its original producer.